
Indicator Gauge Icon Legend
Legend Colors
Red is bad, green is good, blue is not statistically different/neutral.
Compared to Distribution
 the value is in the best half of communities.
 the value is in the 2nd worst quarter of communities.
 the value is in the worst quarter of communities.
Compared to Target
 meets target;
  does not meet target.
Compared to a Single Value
 lower than the comparison value;
 higher than the comparison value;
 not statistically different from comparison value.
Trend

 non-significant change over time;
 significant change over time;
  no change over time.
Compared to Prior Value
 higher than the previous measurement period;
 lower than the previous measurement period;
 no statistically different change from previous measurement period.
 Significantly better than the overall value
 Significantly worse than the overall value
 No significant difference with the overall value
 No data on significance available
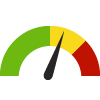
Mortgaged Owners Spending 30% or More of Household Income on Housing
Measurement Period: 2022
This indicator is archived and is no longer being updated. Click to learn more
This indicator shows the percentage of mortgaged owners who are spending 30% or more of their household income on housing. Mortgaged monthly owner costs are comprised of mortgage, second mortgage, home equity loan or line of credit, utilities (electricity, gas, other fuels, water), real estate taxes, property insurance, and any mobile home costs or condominium fees that may be applicable.
Why is this important?
Spending a high percentage of household income on housing can create financial hardship, especially for lower-income homeowners. With a limited income, high monthly housing costs may not leave enough money for other expenses, such as food, transportation and medical. Moreover, high housing costs reduce the proportion of income a household can allocate to savings each month.
The Healthy People 2030 national health target is to reduce the proportion of families that spend more than 30 percent of income on housing to 25.5 percent.
25.4%
Source:
American Community Survey 1-Year
Measurement period: 2022
Maintained by: Conduent Healthy Communities Institute
Last update: November 2023
Measurement period: 2022
Maintained by: Conduent Healthy Communities Institute
Last update: November 2023
Compared to

Technical note: The U.S. Census Bureau calculates 90% confidence intervals for American Community Survey estimates. Use caution when interpreting values with wide confidence intervals. Confidence intervals that are farther away from estimates in either direction indicate uncertainty due to small survey sample sizes. There were data collection issues in 2020 that severely affected the ACS data quality of that year. Therefore, data are not available for the 2020 period.
More details:
Graph Selections

Data Source
- American Community Survey 1-Year
Note: This source uses Zip Code Tabulation Areas (ZCTAs) for its Zip Code data. Learn more
Maintained By: Conduent Healthy Communities Institute (Methodology)
Filed under: Economy / Housing & Homes, Social Determinants of Health