
Search for Indicators

2023 CHNA Substance Use Disorder Data
Substance Use Disorder
COMMUNITY INPUT
PRIMARY DATA
• Growing need for outpatient treatment programs
• COVID-19 pandemic exacerbated substance use disorders
Substance use disorders can involve illicit drugs, prescription drugs or alcohol. Opioid use disorders have become especially problematic in recent years. Substance use disorders are linked to many health problems, and overdoses can lead to emergency department visits and deaths.
Primary Data
Substance Use Disorder was another top health need identified by key informants and community survey participants in this CHNA process. 48.1% of survey respondents selected alcohol and substance misuse as the most important health problems in the community. Additionally, 25.2% of survey respondents expressed that there is need for more addiction services in Calvert County. The key informant interview raised the growing need for more outpatient treatment programs in their community. Key informants and survey respondents expressed concern about the long waits to access alcohol/substance use treatment services.
I would say that is also sort of an epidemic-sized problem as far as overdoses and death we experience here in the county as well." - Key Informant
Secondary Data
From the secondary data scoring results, Alcohol & Drug Use which ranked 3rd in the data scoring of all topic areas with a score of 1.51 is used to form the prioritized topic Substance Use Disorder. Further analysis was done to identify specific indicators of concern. Those indicators with high data scores (scoring at or above the threshold of 1.40) were categorized as indicators of concern and are listed in Table 14 in the CHNA. See Appendix A for the full list of indicators categorized within this topic.
Indicator Gauge Icon Legend
Legend Colors
Red is bad, green is good, blue is not statistically different/neutral.
Compared to Distribution
 the value is in the best half of communities.
 the value is in the 2nd worst quarter of communities.
 the value is in the worst quarter of communities.
Compared to Target
 meets target;
  does not meet target.
Compared to a Single Value
 lower than the comparison value;
 higher than the comparison value;
 not statistically different from comparison value.
Trend

 non-significant change over time;
 significant change over time;
  no change over time.
Compared to Prior Value
 higher than the previous measurement period;
 lower than the previous measurement period;
 no statistically different change from previous measurement period.
Age-Adjusted Death Rate due to Drug Use
Value
Compared to:
Age-Adjusted Death Rate due to Drug Use County: Calvert
Age-Adjusted Death Rate due to Drug Use County: Calvert
28.1
Deaths per 100,000 population
(2019-2021)
Compared to:


MD Value
(42.2)
The regional value is compared to the Maryland State value.
US Value
(22.5 in 2017-2019)
The regional value is compared to the national value. The source for the national value is Centers for Disease Control and Prevention
Prior Value
(42.7)
Prior Value compares a measured value with the previously measured value. Confidence intervals were not taken into account in determining the direction of the comparison.
Trend
This comparison measures the indicator’s values over multiple time periods.<br>The Mann-Kendall Test for Statistical Significance is used to evaluate the trend<br>over 4 to 10 periods of measure, subject to data availability and comparability.
Maryland SHIP 2017
(12.6)
<div><span>The Maryland SHIP 2017 Target is to reduce the death rate due to drug use to 12.6 deaths per 100,000 population.</span></div>
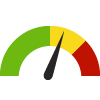
Liquor Store Density
Value
Compared to:
Liquor Store Density County: Calvert
Liquor Store Density County: Calvert
25.6
Stores per 100,000 population
(2021)
Compared to:


MD Counties
The distribution is based on data from 24 Maryland counties.
U.S. Counties
The distribution is based on data from 1,477 U.S. counties and county equivalents.
MD Value
(20.5)
The regional value is compared to the Maryland State value.
US Value
(10.7)
The regional value is compared to the national value.
Prior Value
(22.6)
Prior Value compares a measured value with the previously measured value. Confidence intervals were not taken into account in determining the direction of the comparison.
Trend
This comparison measures the indicator’s values over multiple time periods.<br>The Mann-Kendall Test for Statistical Significance is used to evaluate the trend<br>over 4 to 10 periods of measure, subject to data availability and comparability.
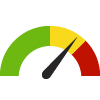
8th grade students that drank alcohol in the past 30-days
Value
Compared to:
8th grade students that drank alcohol in the past 30-days County: Calvert
8th grade students that drank alcohol in the past 30-days County: Calvert
10.5%
Percent %
(2018)
Compared to:
MD Value
(10.3%)
The regional value is compared to the Maryland State value.
Prior Value
(10.1%)
Prior Value compares a measured value with the previously measured value. Confidence intervals were not taken into account in determining the direction of the comparison.
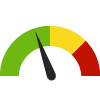
Age-Adjusted Drug and Opioid-Involved Overdose Death Rate
Value
Compared to:
Age-Adjusted Drug and Opioid-Involved Overdose Death Rate County: Calvert
Age-Adjusted Drug and Opioid-Involved Overdose Death Rate County: Calvert
41.7
Deaths per 100,000 population
(2018-2020)
Compared to:
MD Counties
The distribution is based on data from 23 Maryland counties.
U.S. Counties
The distribution is based on data from 1,303 U.S. counties and county equivalents.
MD Value
(39.9)
The regional value is compared to the Maryland State value.
US Value
(23.5)
The regional value is compared to the national value.
Prior Value
(45.4)
Prior Value compares a measured value with the previously measured value. Confidence intervals were taken into account in determining the direction of the comparison.
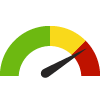
Alcohol-Impaired Driving Deaths
Value
Compared to:
Alcohol-Impaired Driving Deaths County: Calvert
Alcohol-Impaired Driving Deaths County: Calvert
31.7%
Percent of driving deaths with alcohol involvement
(2017-2021)
Compared to:
MD Counties
The distribution is based on data from 24 Maryland counties.
U.S. Counties
The distribution is based on data from 3,116 U.S. counties and county equivalents.
MD Value
(29.4%)
The regional value is compared to the Maryland State value.
US Value
(26.3%)
The regional value is compared to the national value.
Prior Value
(29.6%)
Prior Value compares a measured value with the previously measured value. Confidence intervals were taken into account in determining the direction of the comparison.
Trend
This comparison measures the indicator’s values over multiple time periods.<br>The Mann-Kendall Test for Statistical Significance is used to evaluate the trend<br>over 4 to 10 periods of measure, subject to data availability and comparability.
Death Rate due to Drug Poisoning
Value
Compared to:
Death Rate due to Drug Poisoning County: Calvert
Death Rate due to Drug Poisoning County: Calvert
36.5
Deaths per 100,000 population
(2019-2021)
Compared to:
MD Counties
The distribution is based on data from 24 Maryland counties.
U.S. Counties
The distribution is based on data from 1,899 U.S. counties and county equivalents.
MD Value
(43.1)
The regional value is compared to the Maryland State value.
US Value
(27.2)
The regional value is compared to the national value.
HP 2030 Target
(20.7)
<div>SU-03: Reduce drug overdose deaths <strong>(LEADING HEALTH INDICATOR)</strong></div>
