
Indicator Gauge Icon Legend
Legend Colors
Red is bad, green is good, blue is not statistically different/neutral.
Compared to Distribution
 the value is in the best half of communities.
 the value is in the 2nd worst quarter of communities.
 the value is in the worst quarter of communities.
Compared to Target
 meets target;
  does not meet target.
Compared to a Single Value
 lower than the comparison value;
 higher than the comparison value;
 not statistically different from comparison value.
Trend

 non-significant change over time;
 significant change over time;
  no change over time.
Compared to Prior Value
 higher than the previous measurement period;
 lower than the previous measurement period;
 no statistically different change from previous measurement period.
 Significantly better than the overall value
 Significantly worse than the overall value
 No significant difference with the overall value
 No data on significance available
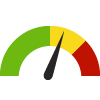
Adolescents who have had a Routine Checkup: Medicaid Population
Measurement Period: 2021
This indicator is archived and is no longer being updated. Click to learn more
This indicator shows the percentage of adolescents ages 13 to 20 enrolled in Medicaid for at least 320 days who visited a doctor for a wellness checkup within the last year.
Why is this important?
Routine checkups are integral to maintaining good health and preventive care. Regular screenings and exams that take place during routine checkups can help diagnose problems before they begin or early on when chances for treatment and cure are better.
40.4%
Source:
Maryland Department of Health
Measurement period: 2021
Maintained by: Conduent Healthy Communities Institute
Last update: March 2024
Measurement period: 2021
Maintained by: Conduent Healthy Communities Institute
Last update: March 2024


Graph Selections

Data Source
- Maryland Department of Health
Maintained By: Conduent Healthy Communities Institute (Methodology)
Filed under: Health / Health Care Access & Quality, Health / Adolescent Health, Clinical Care, Teens