
Indicator Gauge Icon Legend
Legend Colors
Red is bad, green is good, blue is not statistically different/neutral.
Compared to Distribution
 the value is in the best half of communities.
 the value is in the 2nd worst quarter of communities.
 the value is in the worst quarter of communities.
Compared to Target
 meets target;
  does not meet target.
Compared to a Single Value
 lower than the comparison value;
 higher than the comparison value;
 not statistically different from comparison value.
Trend

 non-significant change over time;
 significant change over time;
  no change over time.
Compared to Prior Value
 higher than the previous measurement period;
 lower than the previous measurement period;
 no statistically different change from previous measurement period.
 Significantly better than the overall value
 Significantly worse than the overall value
 No significant difference with the overall value
 No data on significance available
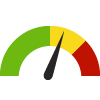
Pedestrian Injuries
Measurement Period: 2022
This indicator is archived and is no longer being updated. Click to learn more
This indicator shows the number of pedestrian injuries on public roads per 100,000 population.
Why is this important?
On average, a pedestrian is killed in a traffic crash every two hours in the United States. Pedestrian fatalities tend to occur in urban areas where, compared to rural regions, there are higher volumes of vehicle and pedestrian traffic. Children between the ages of 5 and 15 and adults 65 and older are at most risk of pedestrian injury or death. Approximately one-half of traffic crashes resulting in a pedestrian death involved an alcohol-impaired driver or pedestrian. The majority of fatalities occur at non-intersections and under dark lighting conditions.
11.6
injuries/ 100,000 population
Source:
Maryland Department of Health
Measurement period: 2022
Maintained by: Conduent Healthy Communities Institute
Last update: March 2024
Measurement period: 2022
Maintained by: Conduent Healthy Communities Institute
Last update: March 2024
Graph Selections

Data Source
- Maryland Department of Health
Maintained By: Conduent Healthy Communities Institute (Methodology)
Filed under: Community / Public Safety, Health / Prevention & Safety, Health Outcomes